


3.4. The size-luminosity distribution function
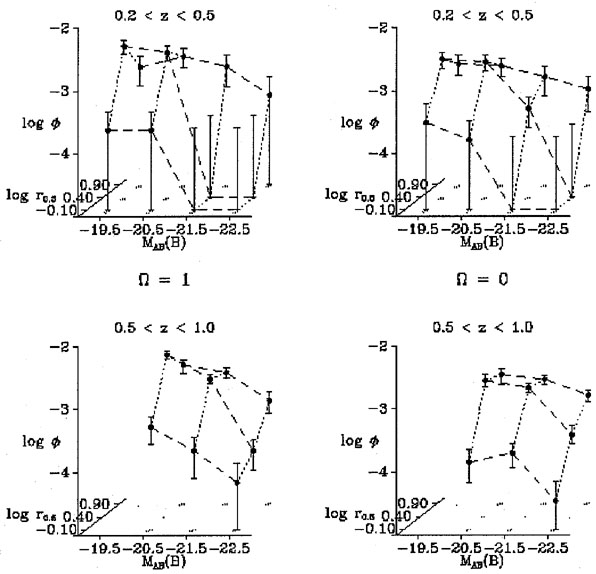
The suggestion that it is smaller galaxies that are driving the increase in star-formation rate to z ~ 1 is more directly illustrated by the bivariate size-luminosity function. The Fig. 5 (from Paper 2) shows the bivariate size-luminosity function for all galaxies in the CFRS sample that has been observed with HST, computed at 0.2 < z < 0.5 and 0.5 < z < 1. For generality, the size parameter used here is a half-light radius, generated from the 2-dimensional fits. No particular distinction has been made between spheroidal and disk components.
|
Figure 5. The bivariate size-luminosity function for all CFRS galaxies, computed in two redshift intervals and for two cosmologies. The size is a half-light radius. The largest evolutionary changes occur for galaxies with moderate sizes and luminosities. |
This diagram shows how the largest evolutionary change is the filling in of the central area of the diagram by the appearance of numerous luminous but moderately sized galaxies. These galaxies have MAB(B) ~ -21.5 and r0.5 < 5h-150 kpc. The "ridge-line" at large sizes at the rear of the figure stays more or less unchanged aside from the effects of the modest brightening described above. Again, however, it should be noted that the impression of differential behavior is weakened for low q0: This is because a given galaxy appears to be larger and more luminous, but rarer, as q0 is decreased.