


3.3.6. cD Galaxies. II. The Extended Envelope
The halos of cD galaxies are enormously larger than those of
ordinary galaxies, whether tidally distended or not.
Figure 15 shows
the brightness profile of a typical example, NGC 6166, whose large size
compared to M31 has been dramatized in Figure 1 of
Morgan and Lesh (1965).
If NGC 6166 were substituted for the Galaxy, it would
reach at least 70% of the way to M31 (distance = 0.65 Mpc,
de Vaucouleurs 1978).
This is by no means the largest cD galaxy known; the cD in A1413
has a limiting radius of  2
Mpc
(Oemler 1976).
Thus these halos are
more nearly cluster-size than galaxy-size. Recent work reveals further
similarities between cD halo and cluster properties, and suggests that
these halos, unlike those of ellipticals, are formed by cluster processes.
2
Mpc
(Oemler 1976).
Thus these halos are
more nearly cluster-size than galaxy-size. Recent work reveals further
similarities between cD halo and cluster properties, and suggests that
these halos, unlike those of ellipticals, are formed by cluster processes.
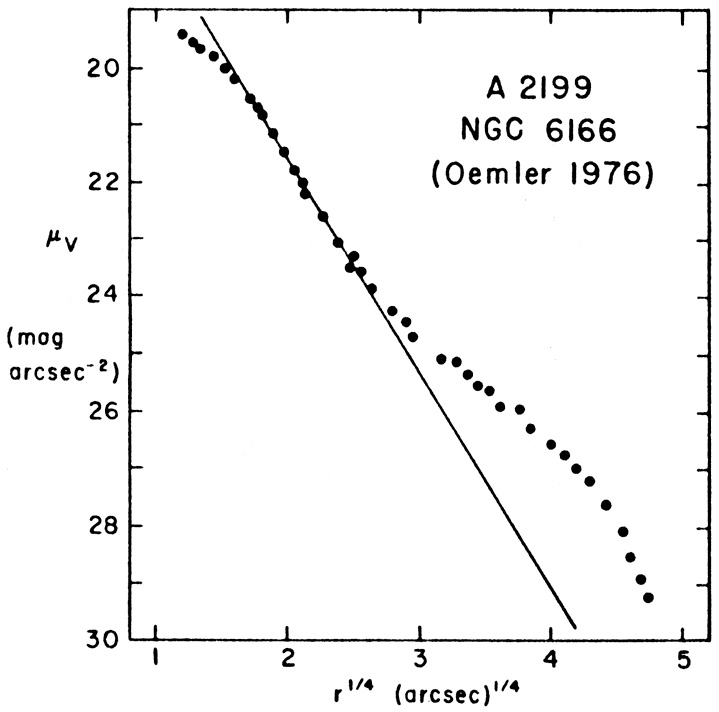 |
Figure 15. Brightness profile of the cD
galaxy NGC 6166
(Oemler 1976).
The straight line is the adopted r1/4-law fit. This has a
smaller range of validity here than in other cDs because of the multiple
nuclei, which result in a large "core radius". Also, the cD halo is
unusually bright. This halo begins at r1/4 ~ 2.8
(r |
Oemler (1973)
has shown that the brightness profile of the cD in
A2670 is proportional to that of the cluster as a
whole, but fainter by
a factor of 1.9. If the cD and cluster profiles continue to be parallel
beyond the outermost measured point, then the halo contains 35% of the
light of the cluster. This is not enough to explain the "missing
mass", but it is dynamically significant. Similarly, the diffuse
background light in the Coma cluster is distributed like the galaxies, and
contributes about one-fourth of the light of the cluster
( 19 ± 4%,
Melnick, White and
Hoessel 1977;
~ 31%,
Thuan and Kormendy
1977).
19 ± 4%,
Melnick, White and
Hoessel 1977;
~ 31%,
Thuan and Kormendy
1977).
The amount of halo light is strongly correlated with cluster
richness
(Oemler 1976;
Thuan and Romanishin
1981).
As shown in Figure 16,
the total luminosities L1 of the brightest galaxies in
rich clusters increase with increasing cluster luminosity as
L1
 Lcluster1.25. If the
luminosity of the main part of the galaxy
(Section 3.3.4) is subtracted, the
halo luminosity Lhalo is found to satisfy
Lhalo
Lcluster2.2. The halo luminosity goes to
zero at Lcluster ~ 1.5 - 2.0 × 10¹²
L
Lcluster1.25. If the
luminosity of the main part of the galaxy
(Section 3.3.4) is subtracted, the
halo luminosity Lhalo is found to satisfy
Lhalo
Lcluster2.2. The halo luminosity goes to
zero at Lcluster ~ 1.5 - 2.0 × 10¹²
L , where
M1 = - 2.5 log L1 + constant = - 23
(H0 = 50 km s-1
Mpc-1). The poor clusters containing cD-like galaxies
(Morgan et al. 1975;
Albert et al. 1977)
generally have Lcluster
, where
M1 = - 2.5 log L1 + constant = - 23
(H0 = 50 km s-1
Mpc-1). The poor clusters containing cD-like galaxies
(Morgan et al. 1975;
Albert et al. 1977)
generally have Lcluster
 2.5 ×
1012
L,
which is approximately
the luminosity at which cD halos first appear. And, in fact, none of
these "cDs" are found to depart significantly from
r1/4 laws
(Thuan and Romanishin
1981).
These galaxies appear to be nothing more than
very bright ellipticals. Lacking halos, they have a shallower
L1 - Lcluster relation than cDs in
rich clusters, but the two relationships
are continuous (Fig. 16). Both
Oemler (1976) and
Thuan and Romanishin
(1981)
emphasize the intimate connection between halo formation and
cluster processes. The data are qualitatively consistent with a
picture (e.g.,
Richstone 1976)
in which tidal stripping by galaxy
encounters and by the cluster potential
(White 1982)
produce an
intergalactic sea of stars which is identified as the cD halo. To some
extent, the elliptical galaxy at the center of the cD is a "lucky
bystander"
(Oemler 1976)
which happens to be at the bottom of the same
potential well; the halo really belongs to the cluster. However this
elliptical is the ultimate recipient of galaxies which spiral inward
due to dynamical friction in the halo (both visible and dark). Victims
on their way to being cannibalized leave (both visible and dark) parts
of their halos behind, adding to the cD envelope. It is not an accident
that the brightest elliptical in the cluster tends to be at the
center, because dynamical friction and merging are most rapid for the
most massive galaxies. The above is of course an over-simplified sketch
of one possible way of making cDs; a detailed review is given by
White (1982).
Within this picture it is not surprising that poor clusters
lack cD halos: there is not enough material present to make them. For
example, the brightest halo in Figure 16 has
MV
2.5 ×
1012
L,
which is approximately
the luminosity at which cD halos first appear. And, in fact, none of
these "cDs" are found to depart significantly from
r1/4 laws
(Thuan and Romanishin
1981).
These galaxies appear to be nothing more than
very bright ellipticals. Lacking halos, they have a shallower
L1 - Lcluster relation than cDs in
rich clusters, but the two relationships
are continuous (Fig. 16). Both
Oemler (1976) and
Thuan and Romanishin
(1981)
emphasize the intimate connection between halo formation and
cluster processes. The data are qualitatively consistent with a
picture (e.g.,
Richstone 1976)
in which tidal stripping by galaxy
encounters and by the cluster potential
(White 1982)
produce an
intergalactic sea of stars which is identified as the cD halo. To some
extent, the elliptical galaxy at the center of the cD is a "lucky
bystander"
(Oemler 1976)
which happens to be at the bottom of the same
potential well; the halo really belongs to the cluster. However this
elliptical is the ultimate recipient of galaxies which spiral inward
due to dynamical friction in the halo (both visible and dark). Victims
on their way to being cannibalized leave (both visible and dark) parts
of their halos behind, adding to the cD envelope. It is not an accident
that the brightest elliptical in the cluster tends to be at the
center, because dynamical friction and merging are most rapid for the
most massive galaxies. The above is of course an over-simplified sketch
of one possible way of making cDs; a detailed review is given by
White (1982).
Within this picture it is not surprising that poor clusters
lack cD halos: there is not enough material present to make them. For
example, the brightest halo in Figure 16 has
MV  -25.8 or L ~ 1012.2
L. This
is as bright as the whole cluster luminosity at which cD halos first appear.
Thuan and Romanishin
(1981)
also point out that the collision time in poor clusters is longer than a
Hubble time.
-25.8 or L ~ 1012.2
L. This
is as bright as the whole cluster luminosity at which cD halos first appear.
Thuan and Romanishin
(1981)
also point out that the collision time in poor clusters is longer than a
Hubble time.
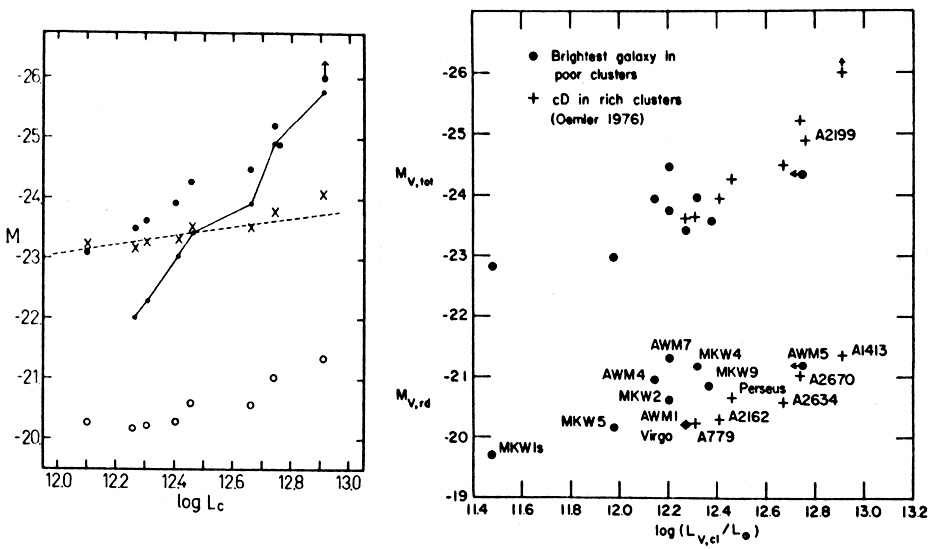 |
Figure 16. Correlations with total cluster
luminosity Lc or LV, cl
of the absolute magnitude of the brightest member. The panel at left
is from
Oemler (1976),
that at right from
Thuan and Romanishin
(1981).
The upper filled circles and plus signs in both panels represent the
total luminosity of the first-ranked galaxy. Open circles (left) and
the lower filled circles and plus signs (right) are the "reduced
magnitudes", Mred = - 2.5 log(I0
a2) + constant, of the part of the
galaxy which is described by a Hubble law. These yield total
magnitudes for the E-galaxy part (crosses, left-hand panel) via an
empirical calibration for ellipticals
(Oemler 1976).
There is still a dependence
on Lc, but it is weaker than for magnitudes which
include the halo.
Also shown in the left panel (chained dots) is the difference between
the total and E-galaxy luminosity, i.e., the halo luminosity. This
increases steeply with increasing Lc. The cD halo
first appears at a cluster luminosity Lc ~
1012.2
L |
Further evidence for or against the above picture can be supplied
by measurements of color gradients. Available data are sparse and
generally inconclusive. e.g.,
Gallagher, Faber and
Burstein (1980)
saw a weak blueward gradient at large radii in NGC 6166, but the
measurements (at µ
25 V mag
arcsec-2) barely reach the start of the
halo (see Figure 15). Also,
Mattila (1977)
measured a patch at 27 G
mag arcsec-2 in the background light of the Coma cluster. He
found
B - V
0.54 ± 0.19, which is bluer than the light of E and S0 galaxies.
Since many ellipticals become bluer at larger radii
(Strom and Strom 1978a,
b,
c,
1979b),
this observation may indicate that the halo consists
of stars stripped from the outer parts of galaxies. However, the
errors are large. Basically, color measurements are another tool that
awaits conclusive exploitation.
The most compelling evidence that cD halos are stripped stars
moving in the cluster potential is provided by measurements of velocity
dispersions  . An early
study
(Faber, Burstein and
Dressler 1977)
derived = 470 ± 250 km
s-1 at 43 kpc radius in the cD in
A401. This
is equal to the nuclear value of 480 ± 120 km s-1, and
clearly smaller
than the cluster dispersion of 1390 km s-1. However, the
errors are
large, and compatible with a contribution as large as 70% from a halo
having the cluster dispersion. More conclusive results were obtained
by Dressler (1979),
who measured the dispersion as a function of radius
in the cD galaxy in A2029 (Figure 17). The
inner halo shows a dramatic
rise of velocity dispersion with radius. These measurements are
difficult, and need to be confirmed. Nevertheless, they imply that cD
halos are dynamically very different from elliptical galaxies, which
have constant or decreasing dispersion profiles
(section 4.2.5). Dressler was
able to fit the brightness profile, the dispersion data, and the
cluster's profile of galaxy densities with an indicative model. This
consisted of a normal elliptical (M/L = 10), a luminous
halo of tidal
debris having M/L = 35 and a dark halo (M/L
> 500) which binds the
cluster. Dressler also discussed other evidence for the origin of cDs
through the accumulation of tidal debris. Finally, a similar rise of
with radius has recently been seen in IC 2082 by
Carter et al. (1981).
. An early
study
(Faber, Burstein and
Dressler 1977)
derived = 470 ± 250 km
s-1 at 43 kpc radius in the cD in
A401. This
is equal to the nuclear value of 480 ± 120 km s-1, and
clearly smaller
than the cluster dispersion of 1390 km s-1. However, the
errors are
large, and compatible with a contribution as large as 70% from a halo
having the cluster dispersion. More conclusive results were obtained
by Dressler (1979),
who measured the dispersion as a function of radius
in the cD galaxy in A2029 (Figure 17). The
inner halo shows a dramatic
rise of velocity dispersion with radius. These measurements are
difficult, and need to be confirmed. Nevertheless, they imply that cD
halos are dynamically very different from elliptical galaxies, which
have constant or decreasing dispersion profiles
(section 4.2.5). Dressler was
able to fit the brightness profile, the dispersion data, and the
cluster's profile of galaxy densities with an indicative model. This
consisted of a normal elliptical (M/L = 10), a luminous
halo of tidal
debris having M/L = 35 and a dark halo (M/L
> 500) which binds the
cluster. Dressler also discussed other evidence for the origin of cDs
through the accumulation of tidal debris. Finally, a similar rise of
with radius has recently been seen in IC 2082 by
Carter et al. (1981).
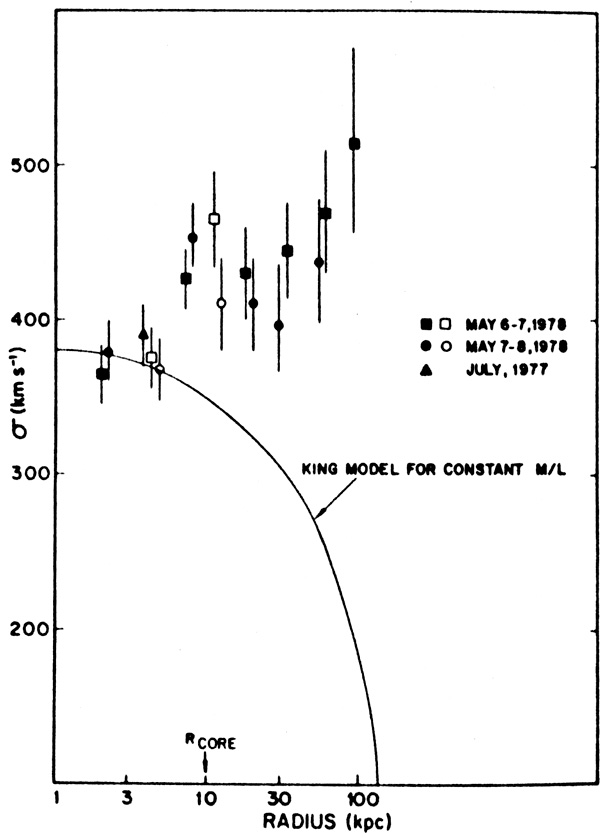 |
Figure 17. Velocity dispersion as a function of radius in the cD galaxy in the cluster A2029 (Dressler 1979). The measurements were made with a SIT spectrograph and the Palomar 5 m telescope. Open and closed symbols refer to points on opposite sides of the center. The solid curve describes a King (1966) model with constant M/L and a core radius of 10 kpc. |
Thus available observations are generally consistent with a picture in which cDs form by the accumulation of tidal debris around a bright elliptical. However, there is too little conclusive evidence on cD formation. There is a great need for more and better measurements of velocity dispersions and color gradients to improve on the above results.