


3.2. Global Mechanical Feedback
Another approach to understanding superbubble evolution is in examining the statistical properties of superbubble populations in galaxies. It is possible to derive the distributions in, for example, size and expansion velocity from equations 9 and assumptions for the mechanical luminosity function (MLF), object creation rate, and ambient parameters. Oey & Clarke (1997) analytically derived the superbubble size distribution for simple combinations of creation rate and MLF. They found that the size distribution is dominated by pressure-confined objects that are no longer growing, following a differential distribution in radius R:
 |
(3.3) |
where  is the
power-law slope of the MLF
is the
power-law slope of the MLF
 (L) for the
form, (L)
(L) for the
form, (L)
 L-. Since the mechanical power L
is determined by the SN progenitors (equation 10), the MLF
to first order has the universal power-law slope of -2 given by
equation 6. Equation 11 shows that the form of
the MLF turns out to be a vital parameter in determining the size
distribution. For the MLF slope
= 2, the
size distribution N(R) dR
R-3
dR. There is a peak in
N(R), corresponding to the stall radius of the
lowest-L objects, which would be individual SNRs in this analysis
(Figure 5).
L-. Since the mechanical power L
is determined by the SN progenitors (equation 10), the MLF
to first order has the universal power-law slope of -2 given by
equation 6. Equation 11 shows that the form of
the MLF turns out to be a vital parameter in determining the size
distribution. For the MLF slope
= 2, the
size distribution N(R) dR
R-3
dR. There is a peak in
N(R), corresponding to the stall radius of the
lowest-L objects, which would be individual SNRs in this analysis
(Figure 5).
 |
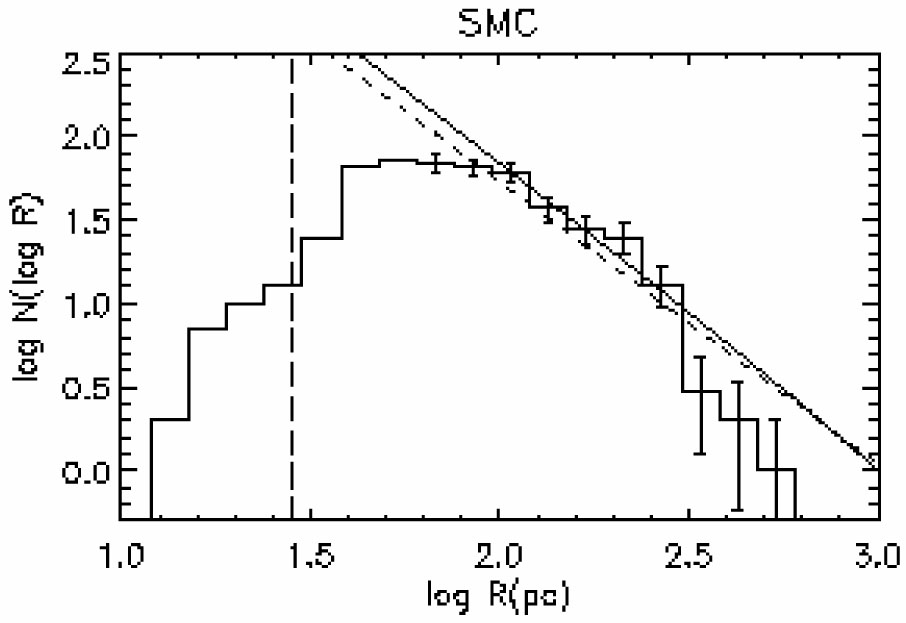 |
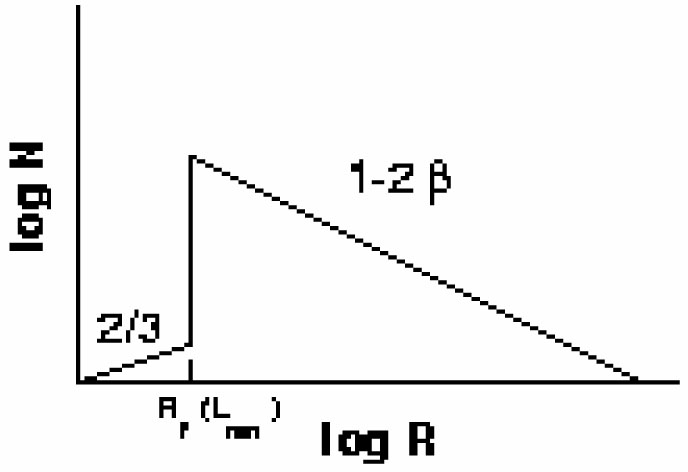
Figure 5. Left: Schematic
representation of the predicted
superbubble size distribution for a power-law MLF of slope -
|
|
This prediction can be compared to the observed size distribution of H I shells that have been catalogued in the largest Local Group galaxies. By far the most complete catalog is that for the Small Magellanic Cloud (SMC; Staveley-Smith et al. 1997). The companion survey for the LMC (Kim et al. 1999) surprisingly shows about four times fewer shells than the SMC, in spite of the former's much larger size. The number of H I shells in the LMC is also much smaller than expected from the number of H II regions, whereas their relative numbers are fully consistent with their respective life expectancies in the SMC (Oey & Clarke 1997). Thus it appears that some process may be destroying the LMC shells prematurely, perhaps merging, shearing in the disk, or other ISM dynamical processes related to the high LMC star-formation rate and/or disk morphology. In contrast, the SMC has a more 3-dimensional, solid-body kinematic structure, and thus offers a better ISM for comparison with the crude size distribution predictions.
For the SMC, the observed H I shell size distribution has a slope of -2.7 ± 0.6, in remarkable agreement with the predicted slope of -2.8 ± 0.4 derived from the actual H II LF (Oey & Clarke 1997; Figure 5). This suggests that the bubbly structure in the neutral ISM of this galaxy can be entirely attributed to mechanical feedback. It is also worth noting that a size distribution of fractal holes can be derived from the same dataset (Stanimirovic et al. 1999). The power-law slope of -3.5 for the holes is similar, but different, from that for the shells, so it will be extremely interesting to make further such comparisons in other galaxies.
H I shell catalogs also have been compiled for M31 (Brinks & Bajaja 1986) and M33 (Deul & den Hartog 1990). These older catalogs lack sensitivity and resolution, but preliminary comparisons of the shell size distributions are broadly in agreement with the prediction (Oey & Clarke 1997). A modern H I survey of M33 by Thilker et al. (2000) is also eagerly anticipated. For the Milky Way, no complete samples of H I shells exist, but the International Galactic Plane Surveys (IGPS; e.g., McClure-Griffiths et al. 2002) may eventually yield data useful for a statistically significant sample.
Similarly, it is possible to derive the distribution in expansion velocities for the shells. Oey & Clarke (1998b) find,
 |
(3.4) |
Again, comparison with the SMC catalog shows consistency with the prediction, although with much larger uncertainty in the observed slope of -2.9 ± 1.4. Although taken from the same dataset, this comparison examines a different subset of objects, since the shells with non-negligible expansion velocities clearly sample the growing objects, whereas the size distribution is dominated by pressure-confined, stalled objects.
The Local Group galaxies, especially the Magellanic Clouds, also provide an opportunity to examine the detailed morphology of the ISM. An especially compelling discussion is presented by Elmegreen et al. (2001), who compare the structural morphology of the neutral ISM in the LMC with a fractal model. They show that the LMC's ISM is clearly more filamentary than accounted for in their simple fractal model (Figure 6). Such filamentary structure can be attributed at least in part to the superbubble structuring caused by mechanical feedback. Oey (2002) reviews H I structure in the ISM and argues that the origin of filamentary structure is key to understanding the dynamical and evolutionary processes in the ISM, such as phase balance and star formation.
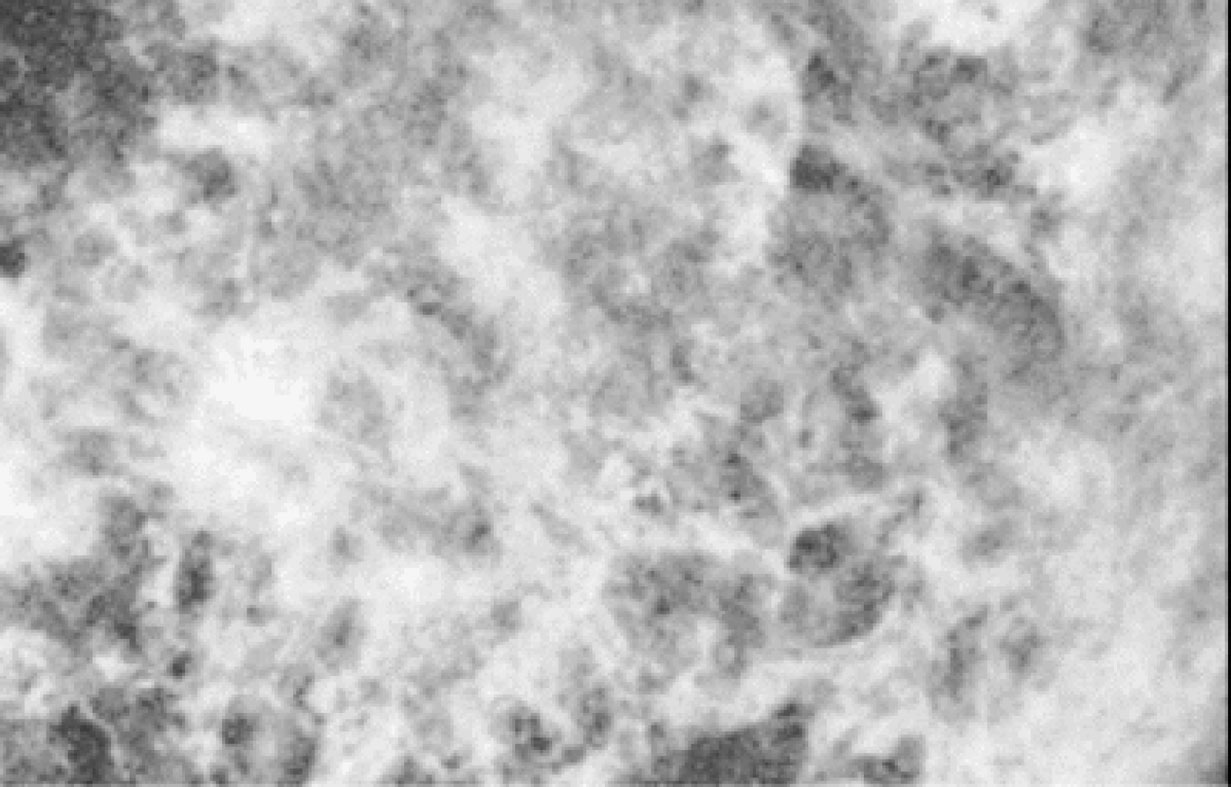 |
Figure 6. H I distribution in a central region of the LMC (white is positive), showing a filamentary ISM morphology that is inconsistent with simple fractal models (from Elmegreen et al. 2001). |