Copyright © 2005 by Annual Reviews. All rights reserved
| Annu. Rev. Astron. Astrophys. 2005. 43:
727-768 Copyright © 2005 by Annual Reviews. All rights reserved |


The CIB is the infrared part of the extragalactic background, the radiation content of the Universe today produced by galaxies at all redshifts and seen as an isotropic extragalactic background radiation. Patridge & Peebles (1967) predicted that observations of such a background could give powerful constraints on the cosmological evolution.
3.1. General Observations and Direct Cosmological Implications
The detection of the infrared part of the extragalactic background
(the CIB for Cosmic Infrared Background) was the major objective of
the DIRBE experiment aboard COBE. In fact, the CIB was first detected
at long wavelengths by using the FIRAS spectrometer:
 >
200 µm
(Puget et al. 1996).
The CIB has subsequently been
detected by DIRBE at 2.4, 3.5, 100, 140, 240 µm (see
Hauser & Dwek 2001
and
Kashlinsky 2005
for two reviews). The extragalactic
background at 2.4 and 3.5 µm is significantly larger than that
predicted by the integrated galaxy counts and their extrapolation.
Similarly, the extragalactic background in the optical has been
finally evaluated in combining several methods by
Bernstein et al. (2002)
and found to be larger than the value given by the
integrated fluxes of galaxies by a factor larger than 2. In the
mid-infrared, the interplanetary zodiacal dust emission is so strong
that only upper limits were obtained by DIRBE. The combination of
number counts by ISO/ISOCAM at 15 µm (see
Elbaz & Cesarsky
2003)
and by Spitzer at 24 µm (e.g.,
Papovich et al. 2004)
giving lower limits, with the observations of TeV gamma ray
emission from distant AGNs (e.g.,
Renault et al. 2001;
Dwek & Krennrich
2005),
gives a good measurement of the background at these
wavelengths. The full cosmic background spectrum is shown in
Figure 2. Only most recent and strongly
constraining measurements have been plotted for clarity.
>
200 µm
(Puget et al. 1996).
The CIB has subsequently been
detected by DIRBE at 2.4, 3.5, 100, 140, 240 µm (see
Hauser & Dwek 2001
and
Kashlinsky 2005
for two reviews). The extragalactic
background at 2.4 and 3.5 µm is significantly larger than that
predicted by the integrated galaxy counts and their extrapolation.
Similarly, the extragalactic background in the optical has been
finally evaluated in combining several methods by
Bernstein et al. (2002)
and found to be larger than the value given by the
integrated fluxes of galaxies by a factor larger than 2. In the
mid-infrared, the interplanetary zodiacal dust emission is so strong
that only upper limits were obtained by DIRBE. The combination of
number counts by ISO/ISOCAM at 15 µm (see
Elbaz & Cesarsky
2003)
and by Spitzer at 24 µm (e.g.,
Papovich et al. 2004)
giving lower limits, with the observations of TeV gamma ray
emission from distant AGNs (e.g.,
Renault et al. 2001;
Dwek & Krennrich
2005),
gives a good measurement of the background at these
wavelengths. The full cosmic background spectrum is shown in
Figure 2. Only most recent and strongly
constraining measurements have been plotted for clarity.
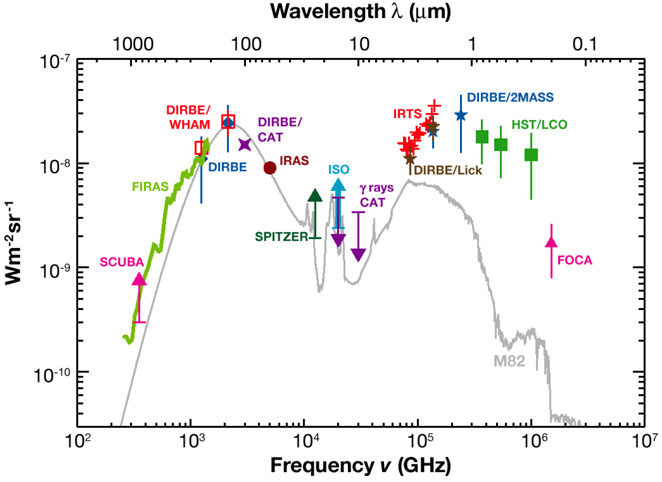 |
Figure 2. The extragalactic background over
three decades in frequency from the
near UV to millimeter wavelengths. Only strongly constraining
measurements have been reported. We show for comparison in grey an SED
of M82
(Chanial, 2003)
- a starburst galaxy at L = 3 × 10¹⁰
L |
| Wavelength (µm) | Experiment | Measurement | Reference |
| 0.2 | FOCA | Number counts & model | Armand et al. 1994 |
| 0.30, 0.56, 0.81 | HST/Las Campanas Observatory | Diffuse emission | Bernstein et al. 2002, Mattila 2003 |
| 2.2 <
< 4 µm |
IRTS | Diffuse emission | Matsumoto et al. 2005 |
| 2.2, 3.3 | DIRBE/Lick | Diffuse emission | Gorjian et al. 2000 |
| 1.25, 2.2 | DIRBE/2MASS | Diffuse emission | Wright 2001 |
| 10, 15 | CAT |  rays rays |
Renault et al. 2001 |
| 15 | ISOCAM | Number counts | Elbaz et al. 1999 |
| 24 | Spitzer/MIPS | Number counts | Papovich et al. 2004 |
| 60 | IRAS | Power spectrum | Miville-Deschênes et al. 2002 |
| 100 | DIRBE | Diffuse emission | Renault et al. 2001 |
| 140, 240 | DIRBE/WHAM | Diffuse emission | Lagache et al. 2000 |
| 140, 240 | DIRBE | Diffuse emission | Hauser et al. 1998 |
| 850 | SCUBA | Number counts | Smail et al. 2002 |
| 200 <
< 1200 |
FIRAS | Diffuse emission | Lagache et al. 2000 |
Figure 2 clearly shows that the optical and
infrared cosmic backgrounds are well separated. The first surprising
result is that the power in the infrared is comparable to the power in the
optical. In contrast, we know that locally, the infrared output of
galaxies is only one third of the optical output. This implies that
infrared galaxies grow more luminous with increasing z faster than
do optical galaxies. A second important property to note is that the
slope of the long wavelength part of the CIB,
I
 1.4
(Gispert et al. 2000),
is much less steep than the long
wavelengths spectrum of galaxies (as illustrated in
Figure 2 with the M82 SED). This implies that
the millimeter CIB is not due to the millimeter emission of the galaxies
that account for the peak of the CIB
(
1.4
(Gispert et al. 2000),
is much less steep than the long
wavelengths spectrum of galaxies (as illustrated in
Figure 2 with the M82 SED). This implies that
the millimeter CIB is not due to the millimeter emission of the galaxies
that account for the peak of the CIB
( 150
µm). The implications in terms
of energy output have been drawn by, e.g.
Gispert et al. (2000).
The infrared production rate per comoving unit volume (a) evolves
faster between redshift zero and 1 than the optical one and (b)
has to stay roughly constant at higher redshifts up to redshift 3 at least.
150
µm). The implications in terms
of energy output have been drawn by, e.g.
Gispert et al. (2000).
The infrared production rate per comoving unit volume (a) evolves
faster between redshift zero and 1 than the optical one and (b)
has to stay roughly constant at higher redshifts up to redshift 3 at least.
3.2. The Status of Deep Surveys: Resolved Fraction of the > 10 µm CIB
Many surveys from the mid-infrared to the millimeter have aimed to resolve the CIB into discrete sources. From short to long wavelengths the significant surveys are the following:
 3 mJy
contribute to ~ 30% of the CIB.
3 mJy
contribute to ~ 30% of the CIB.
Figure 3 shows the capabilities of the different surveys to find distant LIRGs. Spitzer observations at 24 µm are the most powerful tool to find LIRGs up to z ~ 2.2; ISOCAM was limited at z ~ 1.2. Distant ULIRGs are found by deep and large surveys at 24 and 850 µm. Note that capabilities have been computed using the model of Lagache et al. (2004). This empirical model is based on only two populations of galaxies; it aims only to model the redshift evolution of the average population. It reproduces all the observations from mid-infrared to the millimeter (see Appendix). Lewis et al. (2005) showed that a more sophisticated, bivariate SED does not much change the average properties although it does significantly change the dispersion. The Lagache et al. (2004) model is thus used in this paper as a tool to discuss observations and predictions.
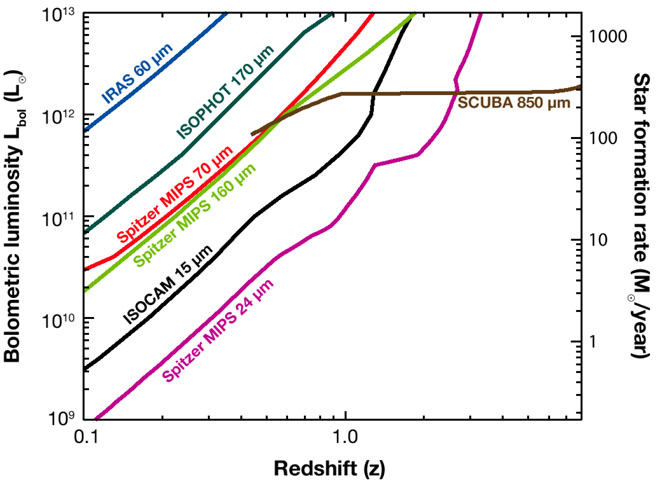 |
Figure 3. Sensitivity to the bolometric
luminosity and star-formation
rate, assuming star forming galaxies of various infrared and
submillimeter experiments. Detections of at least 10 sources in the
surveys can be expected in the areas above the curves.
We assumed the scenario of a typical deep survey (when available).
IRAS 60 µm
(S |
3.3. Redshift Contribution to the CIB
From Figure 2, we see that contributions from
galaxies
at various redshifts are needed to fill the CIB SED shape. The bulk
of the CIB in energy, i.e., the peak at about 150 µm, is not
resolved in individual sources but one dominant contribution at the
CIB peak can be inferred from the ISOCAM deep surveys. ISOCAM galaxies
with a median redshift of ~ 0.7 resolve about 80% of the CIB at
15 µm.
Elbaz et al. (2002)
separate the 15 µm galaxies
into different classes (ULIRGs, LIRGs, Starbursts, normal galaxies and
AGNs) and extrapolate the 15 µm fluxes to 140 µm
using template SEDs. A total brightness of (16 ± 5) nW
m-2 sr-1
is found, which makes up about two thirds of the CIB observed at 140
µm by COBE/DIRBE. Hence, the galaxies detected by ISOCAM are
responsible for a large fraction of energy of the CIB. About one half
of the 140 µm CIB is due to LIRGs and about one third to
ULIRGs. However, these ISOCAM galaxies make little contribution to the
CIB in the millimeter and submillimeter. There, the CIB must be
dominated by galaxies at rather high redshift for which the SED peak
has been shifted. The redshift contribution to the CIB is illustrated
in Figure 4. We clearly see that the
submillimeter/millimeter CIB contains information on the total energy
output by the high-redshift galaxies (z > 2). This is
supported by the
redshift distribution of the SCUBA sources at 850 µm with
S850 3 mJy that
make about 30% of the CIB and have a median redshift of 2.2
(Chapman et al. 2005).
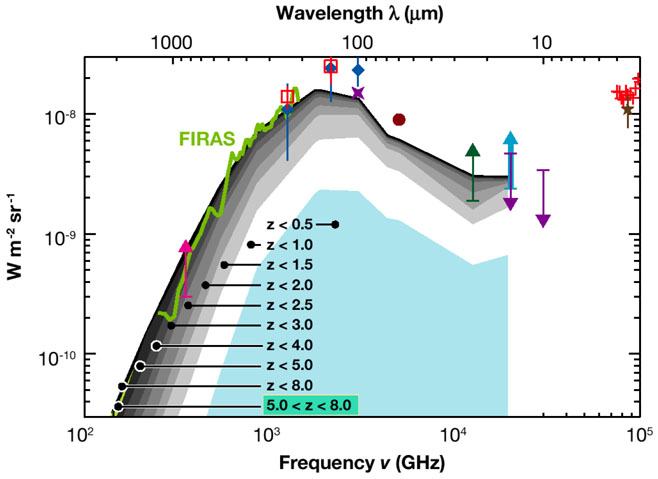 |
Figure 4. Cumulative contribution to the CIB of galaxies at various redshifts from 0.5 to 8, from the model of Lagache et al. (2004). Measurements of the CIB are reported with the same symbols as in Figure 2. |
Figure 5 shows the fraction of resolved CIB as a function of redshift for selected wavelengths. Fifty percents of the CIB is due to galaxies at redshift below 1 at 15 and 70 µm, 1.3 at 24 and 160 µm, 2 at 350 µm, 3 at 850 µm and 3.5 at 2000 µm (see also Table 2). It is clear that from the far-infrared to the millimeter, the CIB at longer wavelengths probes sources at higher redshifts.
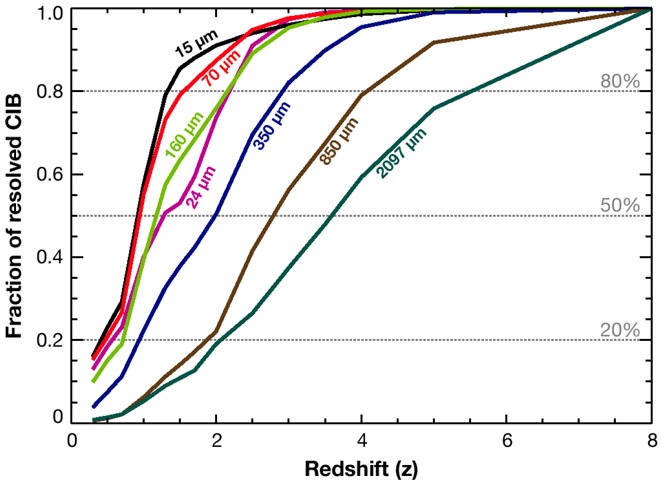 |
Figure 5. Cumulative fraction of the CIB content as a function of redshift for various wavelengths, from the model of Lagache et al. (2004). |
| Wavelength | 20% | 50% | 80% |
| 15 µm | 0.5 | 1.0 | 1.3 |
| 24 µm | 0.5 | 1.3 | 2.0 |
| 70 µm | 0.5 | 1.0 | 1.5 |
| 100 µm | 0.7 | 1.0 | 1.7 |
| 160 µm | 0.7 | 1.3 | 2.0 |
| 350 µm | 1.0 | 2.0 | 3.0 |
| 850 µm | 2.0 | 3.0 | 4.0 |
| 1.4 mm | 2.5 | 3.5 | 4.5 |
| 2.1 mm | 2.0 | 3.5 | 5.0 |
From Section 3.2, we see that the most constraining surveys in term of resolving the CIB are those at 15, 24 and 850 µm. Moreover, the capabilities of these surveys to find high-z objects are the best among all other existing surveys (see Figure 3). These surveys probe the CIB in well-defined and distinct redshift ranges, with median redshifts of 0.7 (Liang et al. 2004), ~ 1 (Caputi et al. 2005 and L. Yan, private communication), and 2.2 (Chapman et al. 2005) at 15, 24 and 850 µm, respectively. Such well-defined redshift ranges can be understood by looking at the K-correction. The K-correction is defined as:
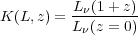 |
(1) |
where
L(z
= 0) is the rest-frame luminosity. This correction is
specific to the spectrum of the population considered at a given
luminosity and redshift. Figure 6 shows the
K-correction at 15, 24, 70, 160 and 850 µm. The broad plateau
observed around z = 1 at 15 µm and around z =
2 at 24 µm is caused by the PAHs' features. At longer
wavelengths, the slow
decrease of the K-correction is caused by the shape of the starburst
spectra around the peak of their emission. At 850 µm, the
monotonic rise favors the detection of high-z objects.
 |
Figure 6. K-correction at 15, 24, 70 and
160 and 850 µm for a typical LIRG with L = 2 ×
1011
L |
 - normalized
to the peak of the CIB at 140 µm. References
for data points are given in
- normalized
to the peak of the CIB at 140 µm. References
for data points are given in