


Many galaxies that are not AGNs have strong emission lines in their
spectra; only about 10% of the Markarian galaxies are Seyferts and the
remaining 90% are nearly all HII region galaxies. A significant
fraction of the latter have quite strong [O III]
 4959, 5007, as in
Seyfert 2 galaxies. To segregate the AGNs from the H II region
galaxies is one of the main goals of emission-line galaxy spectral
classification. A straightforward way to do this is by using numerical
criteria based on ratios of emission line strength, as first proposed
by Baldwin, Phillips
and Terlevich (1981).
They explored many different pairs of ratios;
Veron (1981),
at about the same time, used
[O III] 5007 /
H
4959, 5007, as in
Seyfert 2 galaxies. To segregate the AGNs from the H II region
galaxies is one of the main goals of emission-line galaxy spectral
classification. A straightforward way to do this is by using numerical
criteria based on ratios of emission line strength, as first proposed
by Baldwin, Phillips
and Terlevich (1981).
They explored many different pairs of ratios;
Veron (1981),
at about the same time, used
[O III] 5007 /
H vs [N II]
6583 /
H, which has the
advantage that both
ratios are nearly independent of the exact reddening, and of a highly
accurate calibration of the sensitivity as a function of wavelength.
Keel (1983b)
used the three ratios [N II]
6583 /
H
vs [N II]
6583 /
H, which has the
advantage that both
ratios are nearly independent of the exact reddening, and of a highly
accurate calibration of the sensitivity as a function of wavelength.
Keel (1983b)
used the three ratios [N II]
6583 /
H , are [S
II] (6716 +
6731) /
H and [O I]
6300 /
H for the same reason.
Veilleux and Osterbrock (1987) obtained, collected and analyzed a
large body of data involving all three of these ratios as functions of
[O III] 5007
/ H.
, are [S
II] (6716 +
6731) /
H and [O I]
6300 /
H for the same reason.
Veilleux and Osterbrock (1987) obtained, collected and analyzed a
large body of data involving all three of these ratios as functions of
[O III] 5007
/ H.
|
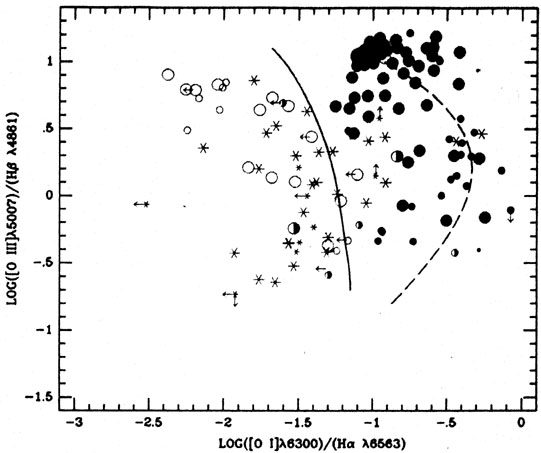
Figure 4. [O III]
/ H |
The results are shown in graphical form in
Figures 4, 5, and
6. In
all three diagrams to the solid and open circles are the previously
classified AGNs and HII regions respectively. It can be seen that the
two types of objects are well segregated in these diagrams. (The few
objects marked by half-filled circles are cases in which there is some
question about the data or the prior classification.) The [O I] /
H and
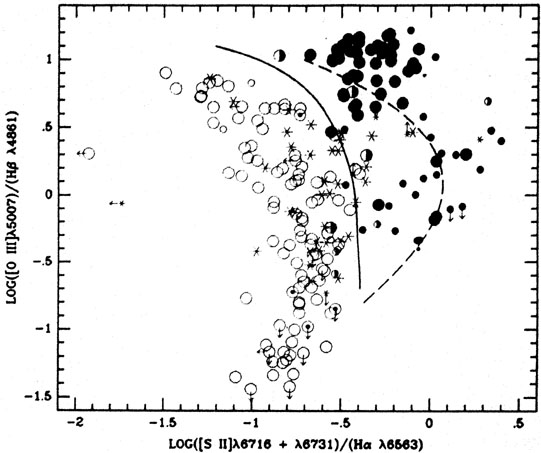
[S II] / [O I] vs [O III] /
H segregations shown in
Figures 4 and 5,
respectively, can be understood directly in terms of the differences
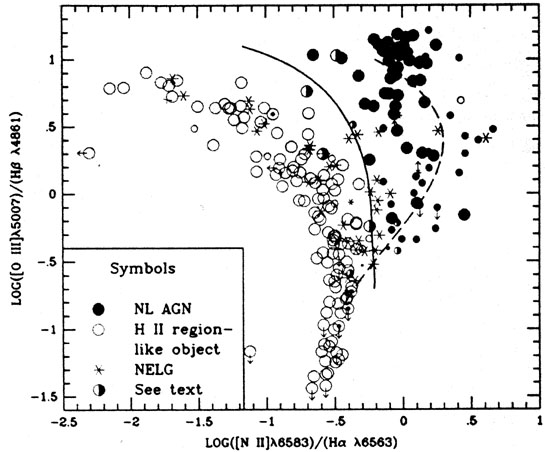
between the photoionizing spectra of O stars and of AGNs, while the [N
II] / H vs [O III] /
H segregation is
less straightforward but is well
reproduced by the models. The solid line in all three diagrams shows
the best adopted division between HII region galaxies and AGNs. The
galaxies not previously classified, indicated by stars, were put into
one class or the other on the basis of these diagrams. For nearly all
of these galaxies, all the ratios measured give the same
classification. The [O III] /
H vs [O I] /
H diagram
(Figure 4) is the
best single criterion for separating AGNs from HII region galaxies,
but because [O I] 6300 is
weak even in AGNs, it requires the best to
signal-to-noise ratio on the spectra. If possible it is best to use
all three ratios; if they do not all agree the average classification
should not be adopted, but instead the object should be regarded as
peculiar and deserving further study.
|
Figure 5. [O III] /
H |
|
Figure 6. [O III] /
H |
The dashed lines in all three diagrams are from a series of AGN
photoionization models calculated by
Binette (1985)
for a power-law input spectrum, of the form
F
 -n, with n = 2. The
ionization
parameter decreases along the series, from
-n, with n = 2. The
ionization
parameter decreases along the series, from
 = 10-2.2 at the top end of
each of the dashed lines to =
10-8 at the bottom end. The abundances
of the elements are solar, and the mean electron density is
Ne
= 10-2.2 at the top end of
each of the dashed lines to =
10-8 at the bottom end. The abundances
of the elements are solar, and the mean electron density is
Ne  102.5 cm-3.