Copyright © 2005 by Annual Reviews. All rights reserved
| Annu. Rev. Astron. Astrophys. 2005. 43:
727-768 Copyright © 2005 by Annual Reviews. All rights reserved |


 1.5
1.5
Analysis of the CIB in the light of the ISO observations shows that, as
we go to wavelengths much longer than the emission peak,
the CIB should be dominated by galaxies at higher redshifts as
illustrated in Figure 4.
The comoving infrared production rate needed to fill the CIB around
1mm at a redshift centered around 2.5 to 3 remains comparable to the
one from galaxies detected in the ISOCAM surveys and filling 65% of
the peak of the CIB. In this section we discuss the rapidly growing
observational evidence that this picture is basically correct. The
main source of these observations has been the SCUBA submillimeter
observations at 850 µm and 450 µm (see
Blain et al 2002
for a review) and observations from the MAMBO instrument on the IRAM 30-m
telescope at 1.2 mm
(Greve et al. 2004).
The negative K-correction
becomes very effective at these wavelengths, leading to an almost
constant observed flux for galaxies of the same total infrared
luminosity between redshifts 1 and 5. More recently, the Spitzer
observatory has produced a wealth of early observations
showing that this observatory will contribute much to our
understanding of infrared galaxies at z
1.5.
5.1. Number Counts, Contribution to the CIB
Blank-field deep surveys combined with mapping of areas lensed by
clusters lead to number counts at 850 µm down to 0.5 mJy
(e.g.,
Smail et al. 2002;
Wang et al. 2004).
At 1.2 mm counts have been obtained down to 2.5 mJy (e.g.,
Greve et al. 2004).
The number counts shapes at 850 µm and 1.2 mm are compatible
with the assumption that they are made of the same population
with a flux ratio F850 / F1200 = 2.5.
For a typical ULIRG SED, a 5mJy source at 850 µm has a
luminosity of 1012
L at a redshift of
about 2.5. The large fraction of the background resolved at 850
µm (see Section 3.2) has
interesting consequences. It shows very
directly that if the sources are at redshift larger than 1 (as
confirmed by the redshift surveys discussed below), the infrared
luminosity of the sources that dominate the background is larger than
1012
L. This
is a population with a very different
infrared luminosity function than the local or even the z = 1
luminosity function. The link between this population at high z, and
what has been seen at z ~ 1 (as discussed in
Section 4) will be done by
Spitzer/MIPS observations at 24 µm.
Figure 4 shows that the building on
the bulk of the CIB near its peak (at 150 µm) with redshift
is expected to be similar to the building of the 24 µm
background when the history of the 15 and 70 µm CIB have
larger contributions from redshift-1 sources. The K-correction plots
(Figure 6) show
for 15 µm a hump at z = 1 associated with the
coincidence of the
6-9 µm aromatic features in the ISOCAM filter and a hump at the
same redshift for the 24 µm MIPS filter associated with the
11-14 µm set of aromatic features in the MIPS filter. For the
MIPS filter a second hump is visible at z ~ 2 that corresponds to
6-9 µm features centered on the 24 µm MIPS
filter. ISOCAM
galaxies contribute to about 2/3 of the energy peak of the CIB.
Following the previous considerations, it is easy to understand why
the remaining fraction is likely to be made of sources in the redshift
range 1.5-2.5. The presently detected SMGs with luminosity 1012
L have
an almost constant flux between redshift 1.7 and redshift 2.5 at 24
µm (similar to the constant flux at 850 µm
between redshift 1 and 5). The MIPS 24 µm deep surveys (e.g.,
Papovich et al. 2004)
reach a sensitivity of 50 µJy and thus can
detect all these galaxies when they are starburst-dominated.
Considering the speed of the MIPS it is likely that 24 µm
surveys will become the most efficient way to search for luminous starburst
galaxies up to z = 2.5 and up to 3 for the most luminous ones.
at a redshift of
about 2.5. The large fraction of the background resolved at 850
µm (see Section 3.2) has
interesting consequences. It shows very
directly that if the sources are at redshift larger than 1 (as
confirmed by the redshift surveys discussed below), the infrared
luminosity of the sources that dominate the background is larger than
1012
L. This
is a population with a very different
infrared luminosity function than the local or even the z = 1
luminosity function. The link between this population at high z, and
what has been seen at z ~ 1 (as discussed in
Section 4) will be done by
Spitzer/MIPS observations at 24 µm.
Figure 4 shows that the building on
the bulk of the CIB near its peak (at 150 µm) with redshift
is expected to be similar to the building of the 24 µm
background when the history of the 15 and 70 µm CIB have
larger contributions from redshift-1 sources. The K-correction plots
(Figure 6) show
for 15 µm a hump at z = 1 associated with the
coincidence of the
6-9 µm aromatic features in the ISOCAM filter and a hump at the
same redshift for the 24 µm MIPS filter associated with the
11-14 µm set of aromatic features in the MIPS filter. For the
MIPS filter a second hump is visible at z ~ 2 that corresponds to
6-9 µm features centered on the 24 µm MIPS
filter. ISOCAM
galaxies contribute to about 2/3 of the energy peak of the CIB.
Following the previous considerations, it is easy to understand why
the remaining fraction is likely to be made of sources in the redshift
range 1.5-2.5. The presently detected SMGs with luminosity 1012
L have
an almost constant flux between redshift 1.7 and redshift 2.5 at 24
µm (similar to the constant flux at 850 µm
between redshift 1 and 5). The MIPS 24 µm deep surveys (e.g.,
Papovich et al. 2004)
reach a sensitivity of 50 µJy and thus can
detect all these galaxies when they are starburst-dominated.
Considering the speed of the MIPS it is likely that 24 µm
surveys will become the most efficient way to search for luminous starburst
galaxies up to z = 2.5 and up to 3 for the most luminous ones.
5.2. Redshift Distribution and SEDs of the SMGs
The first obvious question when investigating the nature of the submillimeter galaxies (SMGs) is their redshift distribution. The rather low angular resolution of the submillimeter and millimeter observations made identifications with distant optical galaxies an almost impossible task without an intermediate identification. This is provided by radio sources observed with the VLA with 10 times better angular resolution. The tight correlation between far-infrared luminosity and radio flux (Helou et al. 1985; Condon 1992) provides the needed link. This then allows us to get optical identifications and redshift measurements using 10-m class telescopes. Confirmation of these identifications can then be obtained through CO line observations with the millimeter interferometers such as the Plateau de Bure interferometer. The redshift deduced from the optical lines is confirmed by the CO observations. So far, only a handful of cases have gone through this whole chain of observations (e.g., Genzel et al. 2003; Greve et al. 2005; Neri et al. 2003), but a high success rate gives confidence in the first step of the identification process. The chain will also have to be applied to the tentative counterparts of radio-undetected SMGs that have been found using a certain combination of optical properties (Pope et al. 2005).
The difficulty of making large, blind surveys at 850 µm at the required sensitivity has lead to an attempt to find distant SMGs through blind surveys at different wavelengths. Barger et al. (2000) have observed optically faint radio sources at submillimeter wavelength and demonstrated them to be, so far, the most efficient way to preselect targets for submillimeter observations and to get larger samples of potentially high redshift SMGs. As an example, Chapman et al. (2002) recovered at 850 µm 70% of the blind submillimeter survey sources. This contrasts the recovery rate of MAMBO sources, which is relatively low, ~ 25% (Dannerbauer et al. 2004). It should be noticed that the radio preselection biases the sample against very high redshifts (z < 3) because the radio flux at 1.4 GHz is below the detection limit of the VLA surveys used for this preselection. A model by Chapman et al. (2003b) and by Lewis et al. (2005) illustrate this effect very well (Figure 7). A fraction of the submillimeter-selected sources are missed in such a process at z > 3 (detectability in radio) and around z ~ 1.5 (optical redshifts desert). The number of non identified submillimeter sources (around 30% for S850 > 3 mJy) is consistent with this model. Nevertheless the submillimeter-selected sources do not appear qualitatively different from the optically-faint-radio selected ones. Another bias is the effect of the dust effective temperature of the SMGs (Lewis et al. 2005). At a given total far-infrared luminosity, hotter sources have lower submillimeter fluxes if the radio/far-infrared correlation continues to hold. They could be missed in the submillimeter surveys (see the discussion in Chapman et al. 2005).
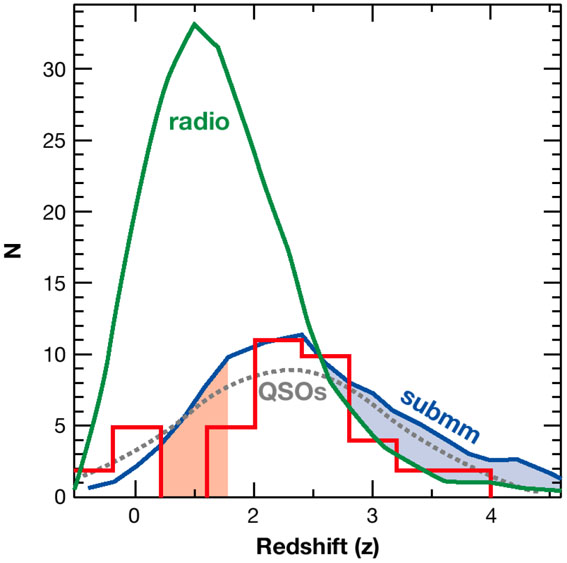 |
Figure 7. The observed histogram of the redshift distribution for the 55 radio-identified SCUBA galaxies (red histogram). Curves derived for a model of the radio/submillimeter galaxy populations (Chapman et al. 2003b; Lewis et al. 2005) are overplotted suggesting that the redshifts of the sources missed in the radio identification process lie mostly at redshifts ~ 3-5 between the radio and submillimeter model tracks. A sample of radio-selected QSOs is also overplotted (gray dotted line), revealing a remarkable similarity with the observed distribution for submillimeter galaxies. From Chapman et al. 2003a. |
Chapman et al. (2003a) got spectroscopic redshifts of 55 sources obtained in this way. The redshift distribution for these sources is shown in Figure 7 (note that when this review was being edited, Chapman et al. (2005) publish spectroscopic redshifts for 73 SMGs). This distribution peaks at z = 2.4 with a substantial tail up to z = 4. In fact the redshift distribution can be represented by a Gaussian distribution centered on 2.4 and with a sigma of 0.65. Almost all SMGs are found in the redshift range 1.5 < z < 3. This redshift distribution is compared with that of the redshift distribution for a pure radio sample in Figure 7. The SMGs selected in the way described above is also shown to be very similar to the redshift distribution of the radio-selected QSOs. This observation is interesting in the context of high rate of AGN activity detected in SMGs.
The determination of the SED of millimeter/submillimeter galaxies remains an open question despite a lot of work in the last few years. The SCUBA and MAMBO data provide constraints on the flux and spectrum at long wavelengths; Spitzer observations constrain the near and mid-infrared. The far-infrared part of the SED remains the least precisely known. Low angular resolution makes 70 and 160 µm deep surveys confusion-limited at 3 and 40 mJy (Dole et al. 2004b). These limits are too high to complete the SED of the SMGs (see Figure 9). Stacking sources will help to go deeper than the confusion limit when large samples of SMGs are available in MIPS cosmological surveys. A first attempt on a radio-selected sample lowered the limit down to 1.2 mJy at 70 µm (Frayer et al. 2004). They find a typical flux ratio I(70) / I(24) < 7 that they interpret to be low when compared with low-redshift starburst. However, such low ratios are typical of dusty starbursts placed at redshift greater than 1.5. It is thus likely that the lower colors are due to a redshift effect. Appleton et al. (2004) looked at the mid- and far-infrared fluxes from a purely radio-selected 1.4 GHz µJy sample of about 500 and 230 sources at 24 and 70 µm, respectively. They show that the far-infrared to radio correlation that is constant out to z = 1 seems to be constant using 24 µm out to z = 2 but with a larger dispersion due systematic variations in SED shape throughout the population. This provides positive evidence of the universality of the infrared/radio correlations out to redshifts of about 2.
Blain et al (2004a) have analyzed SEDs of infrared galaxies assuming that the low-redshift radio/far-infrared correlation applies to SMGs. Under this reasonable assumption and using a model of long-wavelengths SEDs based on a single modified black body, they can choose a single parameter to built an SED that fits the long-wavelengths data and the radio/infrared luminosity ratio. In their paper, this single parameter is the temperature, but it could equally well be the long-wavelength emissivity, because they showed that this is degenerate with temperature. A split between two redshift populations appear in their analysis. The high-z galaxies selected by the submillimeter observations are significantly colder that the low-z galaxies (Dune & Eales, 2001; Stanford et al. 2000), IRAS or IRAS-radio selected. The discrepancy in part probably reflects selection effects in the way these samples were obtained and may reflect the fact that SMGs and local infrared galaxies are distinct populations. It remains an open question what effect this has on the SED model. The main worry is that a single modified black body often does not fit ULIRGs SED when they are known at many frequencies. The SED is broader; the unavoidable temperature distribution of dust in infrared galaxies would affect such an analysis. In fact, the Stanford et al. (2000) sample does not agree well with the single-temperature SED, and this led Lagache et al. (2004) to take broader SEDs for their starburst galaxy templates.
Many LIRGs and ULIRGs at low redshifts have been identified with
interacting or galaxy mergers. A substantial fraction show signs of
AGN activity but it has been shown for the low-redshift LIRGs and
ULIRGs that the starburst component dominates the energy output
(Genzel et al. 1998;
Lutz et al. 1998).
The sources used for the redshift distribution by
Chapman et al. (2003a)
have been imaged with
the HST. Most of them are multi-component-distorted galaxy systems
(Conselice et al. 2003;
Smail et al. 2005).
They display irregular and
frequently highly complex morphologies compared to optically selected
galaxies at similar redshifts. They are often red galaxies with bluer
companions, as expected for interacting, star-forming galaxies. They
have higher concentrations, and more prevalent major-merger
configurations than optically-selected galaxies at z ~ 2-3. Most
strikingly, most of the SMGs are extraordinarily large and elongated
relative to the field population regardless of optical magnitude
(Chapman et al. 2003c).
SMGs have large bolometric luminosities, ~ 1012-1013
L,
characteristic of ULIRGs. If the
far-infrared emission arises from the star formation, the large
luminosities translate to very high SFR
1000
M
year-1. Such high rates are sufficient to form the stellar
population of a massive elliptical galaxy in only a few dynamical
times, given a sufficient gas reservoir. SMGs are very massive
systems with typical mass of 1-2 × 10¹¹
L
(Swinbank et al. 2005),
comparable to the dynamical mass estimates from CO observations.
Genzel et al. (2005;
and more recently
Greve et al. 2005)
have undertaken an ambitious program to study the nature of
the SMGs in more details. They got CO spectra with the Plateau de Bure
interferometer for 7 sources out of their sample of 12 for the CO 3-2
and 4-3 transitions redshifted in the 3 mm atmospheric window. They
provide optical identifications and redshifts. The detection of these
sources at the proper redshift confirms the usefulness of
identification with the help of the radio sources. The median
redshift of this sample is 2.4. In addition, one source was studied
with the SPIFI instrument on the ESO/VLT. These observations are
giving very interesting clues on the nature of the submillimeter
galaxies. The gas masses obtained for these systems using CO
luminosity/mass of gas determined from local ULIRGs is very large with
a median of 2.2 × 10¹⁰
M (10
times larger than in
the Milky Way). Using the velocity dispersion, they could infer that
the dynamical median mass of these systems is 13 times larger than in
Lyman-break galaxies (LBGs) at the same redshift or 5 times the mass
of optically selected galaxies at this redshift. These SMGs with a
flux at 850 µm larger than 5 mJy are not very rare and unusual
objects, because they contribute to about 20% of the CIB at this
frequency. Through multiwavelength observations,
Genzel et al. (2005)
get the stellar component in K band, and infer the star-formation rate
and duration of the star-formation burst. They can then compare the
number density of these massive systems with semiempirical models of
galaxy formation. The very interesting result is that this number
density is significantly larger than the predicted one, although the
absolute numbers depends on a number of assumptions like the IMF. The
comparison is shown in Figure 8. Such massive
systems at high redshift are not easy to understand in current cold dark
matter hierarchical merger cosmogonies. However, one must keep in mind
that bright SMGs (S850 > 5 mJy) that contribute 20% of the CIB
may not be representative of the whole population. Gravitational lens
magnification provides a rare opportunity to probe the nature of the
distant sub-mJy SMGs.
Kneib et al. (2005)
study the property of one SMG with an 850 µm flux
S850 = 0.8 mJy at a redshift of
z = 2.5. This galaxy is much less luminous and massive than other
high-z SMGs. It resembles to similarly luminous dusty starbursts
resulting from lower-mass mergers in the local Universe.
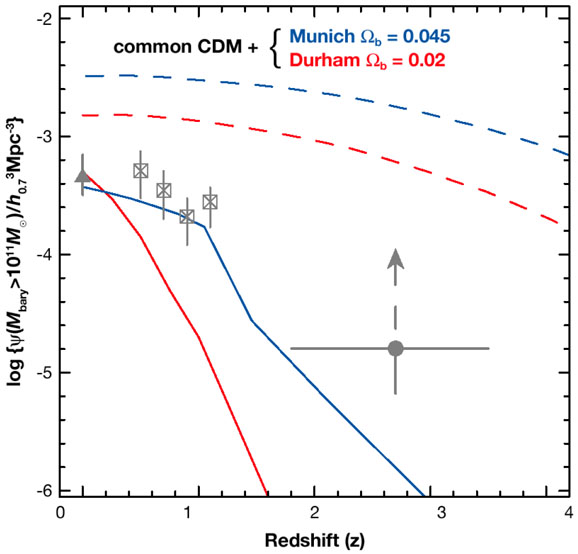 |
Figure 8. Comoving number densities of
galaxies with baryonic masses
|
In order to link the different population of high-redshift objects, several LBGs at redshift between 2.5 and 4.5 have been targeted at 850 µm. The Lyman-break technique (Steidel et al. 1996) detects the rest-frame 91.2 nm neutral hydrogen absorption break in the SED of a galaxy as it passes through several broad-band filters. LBGs are the largest sample of spectroscopically confirmed high-redshift galaxies. Observing LBGs in the submillimeter is an important goal, because it would investigate the link, if any, between the two populations. However, the rather low success rate of submillimeter counterpart of LBGs (e.g., Chapman et al. 2000; Webb et al. 2003) argues against a large overlap of the two populations.
A potential new way to find high-z LIRGs and ULIRGs appeared
recently with the launch of the Spitzer
observatory. Particularly suited to this goal is the 24 µm
channel of the MIPS instrument. The confusion levels in the 70 and 160
µm
prevent detection a significant number of high-redshift objects, and
the IRAC 3.6 to 8 µm at high redshift probes mostly the old
stellar component that is much weaker than the dust emission in
starburst galaxies. At the time of writing, the observations are
under way, and only a few results are available.
Le Floc'h et al. (2004)
give the first hint on the 24 µm selected
galaxies. They couple deep 24 µm observations in the Lockman
hole and extended groth strip with optical and near-infrared data to get
both identification and redshift (either spectroscopic or
photometric). They find a clear class of galaxies with redshift
1  z 2.5 and with
luminosities greater than ~ 5 × 10¹¹
L (see also
Lonsdale et al. 2004).
These galaxies are rather red and massive with M > 2 ×
1010
M
(Caputi et al. 2005).
Massive star-forming galaxies revealed at
2 z
3
by the 24 µm deep surveys are characterized by very high star
formation rates - SFR 500
M
year-1. They are able to construct a mass of
z 2.5 and with
luminosities greater than ~ 5 × 10¹¹
L (see also
Lonsdale et al. 2004).
These galaxies are rather red and massive with M > 2 ×
1010
M
(Caputi et al. 2005).
Massive star-forming galaxies revealed at
2 z
3
by the 24 µm deep surveys are characterized by very high star
formation rates - SFR 500
M
year-1. They are able to construct a mass of
 1011
M in a burst
lifetime ( 0.1 Gyr). The
24 µm galaxy population also
comprises sources with intermediate luminosities (1010
LIR
1011
L) and low to
intermediate assembled stellar masses (109
M1011
M) at
z 0.8. At
low redshifts, however, massive galaxies are also present, but appear
to be building their stars quiescently in long timescales
(Caputi et al. 2005).
At these redshifts, the efficiency of the burst-like mode
is limited to low mass M
1010
M galaxies. These
results support a scenario where star-formation activity is
differential with assembled stellar mass and redshift, and proceed
very efficiently in massive galaxies
(Caputi et al. 2005).
1011
M in a burst
lifetime ( 0.1 Gyr). The
24 µm galaxy population also
comprises sources with intermediate luminosities (1010
LIR
1011
L) and low to
intermediate assembled stellar masses (109
M1011
M) at
z 0.8. At
low redshifts, however, massive galaxies are also present, but appear
to be building their stars quiescently in long timescales
(Caputi et al. 2005).
At these redshifts, the efficiency of the burst-like mode
is limited to low mass M
1010
M galaxies. These
results support a scenario where star-formation activity is
differential with assembled stellar mass and redshift, and proceed
very efficiently in massive galaxies
(Caputi et al. 2005).
In the Lockman Hole, only one galaxy is associated with an X-ray
source. This suggests that these galaxies are mostly dominating by
star formation, consistent with the findings of
Alonso-Herrero et
al. (2004)
and
Caputi et al. (2005).
This is also suggested by SEDs that are best fitted by PAH features
rather than by strongly rising, AGN-type continua
(Elbaz et al. 2005).
The selected sources exhibit a
rather wide range of MIPS to IRAC flux ratio and optical/near-infrared
shapes, suggesting a possibly large diversity in the properties of
infrared galaxies at high redshift as noticed by
Yan et al. (2004b).
Based on these first analyzes, together with the
interpretation of the number counts (e.g.,
Lagache et al. 2004),
it is clear that the 24 µm observations will provide the
sample to unambiguously characterize the infrared galaxies up to
z 2.5. They
should fill the gap between the ISO- and SCUBA-selected galaxies.
Several 24 µm observations have been conducted on selected ERO and SCUBA and MAMBO samples. To our knowledge, LBGs have not been observed at long wavelengths. The MAMBO/SCUBA selected galaxies in the Lockman hole with radio identification have been observed by Spitzer and most of them detected between 3.6 and 24 µm. This allows to get an average SED for these (Egami et al. 2004; Ivison et al. 2004; see Figure 9) Spitzer deep surveys at 24 µm and shallow surveys like the SWIRE legacy (Lonsdale et al. 2004) can easily detect them and are thus a promising new way to find this class of high-z infrared galaxy. Nevertheless, the Early Release Observations from Spitzer have been used to extract their submillimeter flux from a stacking analysis of SCUBA observations in the Lockman hole (Serjeant et al. 2004). In this field, seven SMGs were already known and others were identified by further analysis. For the bulk of the 24 µm sources a marginal detection is found with an S850 / S24 ratio (1/20) much lower than that observed for SMGs. This clearly shows that the SMGs are only a fraction of the 24 µm sources, as expected. An interesting challenge is to find if Spitzer color criteria can be found to extract preferentially SMGs, i.e., the galaxies that account for most of the CIB near 1 mm. The SED in the thermal infrared appears quite variable for LIRGs and ULIRGs making this difficult (e.g., Armus et al. 2004).
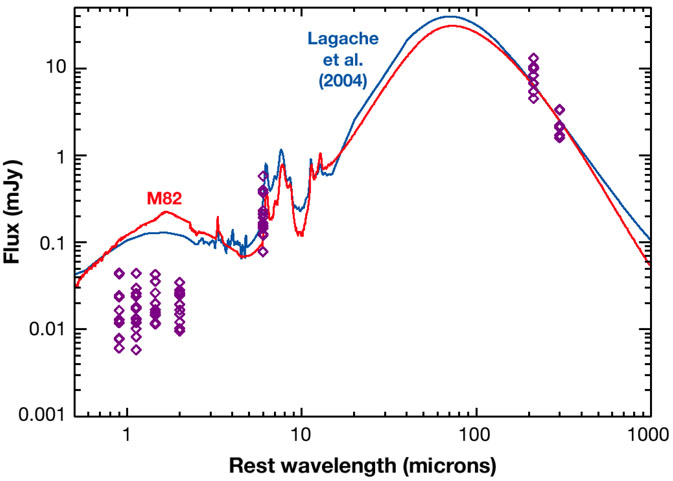 |
Figure 9. Rest-frame SED of 15 SMGs
(assuming a redshift of 3) with MAMBO and/or SCUBA, Spitzer/IRAC
and Spitzer/MIPS 24 µm measurements. Purple
diamonds are the galaxies 208, 119, 115, 48, 44
(Frayer et al. 2004),
LE850_4, LE850_35
(Egami et al. 2004),
and MMJ105201, MMJ105155, MMJ105203, MMJ105216, MMJ105148, MMJ105157,
MMJ105207, MMJ105203
(Ivison et al. 2004M82, normalized at 850 µm (from
Chanial 2003),
and the SED template of the
Lagache et al. (2004)
model, for L = 1013
L |
Extremely Red Objects (EROs) are usually selected based on their red
colors: (R-Ks)
5.3 mag or
(I-Ks)
4 mag. This color
selection should include early-type galaxies at z ~ 1. However, the
color selections are also sensitive to dust-reddened, star-forming
systems. Up to now, it remains unclear what fraction of EROs are truly
dust-obscured galaxies. Different scenarios of galaxy formation
predict very different formation epochs for such galaxies. It is thus
interesting to characterize these galaxies, in particular whether they
belong to the early-type or dusty star-forming class of
objects. Spitzer/MIPS 24 µm observations offer the
first opportunity to
address this issue because 24 µm observations can clearly
discriminate between the two populations. In the N1 field,
Yan et al. (2004a)
suggest that about 50% of EROs are infrared luminous,
dusty starbursts at z
1 (in a similar study,
Wilson et al. (2004)
show that at least 11% of 0.6 < z < 1.3 EROs and at least
22% of z > 1.3 EROs are dusty star-forming galaxies). Their
mean 24 µm flux corresponds to infrared luminosities of
about 3 × 10¹¹ and 1012
L at z ~ 1 and
z ~ 1.5, respectively. They are massive galaxies with lower limit
M5 × 109 to 2
1010 M.
The fraction of EROs likely to be AGN is
small; about 15%. The link between the two classes of EROs could
be that starburst EROs are experiencing, at z > 1, violent
transformations to become massive early-type galaxies.
5.5. ULIRGs and Active Galactic Nuclei at High Redshifts
SMGs are massive ULIRGs at high redshift. One of the key question
discussed above for the z
1 galaxies is to
distinguish whether
starburst or AGN activity powers the dust heating and associated
infrared emission. The presence of an AGN in galaxies can be
investigated using optical/near-infrared, emission line diagnostics
and/or X-ray observations. But the identification of the presence of
an AGN does not mean that it is the dominant source of the
far-infrared emission. Alexander et al.
(2003;
see also
Almaini et al. 2003)
use Chandra observations of the CDF-N to constrain the X-ray
properties of 10 bright SMGs. Half of the sample has flat X-ray
spectral slopes and luminous X-ray emission, suggesting obscured AGN
activity. However, a comparison of the AGN-classified sources to the
well-studied, heavily obscured AGN NGC 6240 suggests that the AGN
contributes on average a negligible fraction (about 1.4%) of the
submillimeter emission. For the MAMBO sources, similar results are
found: only one out of the nine MAMBO sources studied by
Ivison et al. (2004)
has an X-ray counterpart. It has, as expected from low
redshift ULIRGs observations (e.g.,
Rigopoulou et al. 1999),
a different mid-infrared SED than the starburst dominated sources.
About 75% of their sample has rest-frame mid-infrared to far-infrared
SED commensurate with obscured starburst.
Swinbank et al. (2005),
using AGN indicators provided by near-infrared spectra, estimate that
AGNs are present in at least 40% of the galaxies in their sample of
30 SMGs. Emission-line diagnostics suggest that star formation is the
dominant power source. However, the composite spectrum for the
galaxies that individually show no signs of an AGN in their
near-infrared spectra appears to show an underlying broad
H line. This suggests that even these galaxies may host a low-luminosity
AGN that is undetectable in the individual spectra. All these studies
tend to show that starburst activity is the dominant source of power
of dust emission in the far-infrared. Still, it is rather difficult to
estimate the true "contamination" by the AGN. To go deeper,
Chapman et al. (2004)
tried an original approach. They observe a sample of
identified SMGs at high angular resolution in the radio and use the
radio emission as a proxy for the far-infrared emission. This
assumption is based on the well-known very tight far-infrared/radio
correlation mentioned above. If detected, an extended radio (and thus
far-infrared) component is likely to arise from the star
formation. The detection of extended emission requires sub-arcsec
resolution to map emission on kpc-scales. These are accessible by
radio interferometry (they are well beyond far-infrared and
submillimeter facilities capabilities). They find that for 70% of the
SMG sample, the MERLIN/VLA radio exhibits resolved radio emission
which mirrors the general form of the rest frame UV morphology seen by
HST. The galaxies are extended on scales of about 10 kpc. They
interpret this as a strong support for the hypothesis that radio
emission traces spatially extended massive star formation within these
galaxies. This is clearly different from what is seen in local ULIRGs
where the far-infrared/radio emission is concentrated in the compact
nuclear region with an extend less than 1 kpc. In the remaining 30%
of the SMG sample, the radio emission is more compact (essentially
unresolved). This is a signature of either a compact nuclear starburst
and/or an AGN.
line. This suggests that even these galaxies may host a low-luminosity
AGN that is undetectable in the individual spectra. All these studies
tend to show that starburst activity is the dominant source of power
of dust emission in the far-infrared. Still, it is rather difficult to
estimate the true "contamination" by the AGN. To go deeper,
Chapman et al. (2004)
tried an original approach. They observe a sample of
identified SMGs at high angular resolution in the radio and use the
radio emission as a proxy for the far-infrared emission. This
assumption is based on the well-known very tight far-infrared/radio
correlation mentioned above. If detected, an extended radio (and thus
far-infrared) component is likely to arise from the star
formation. The detection of extended emission requires sub-arcsec
resolution to map emission on kpc-scales. These are accessible by
radio interferometry (they are well beyond far-infrared and
submillimeter facilities capabilities). They find that for 70% of the
SMG sample, the MERLIN/VLA radio exhibits resolved radio emission
which mirrors the general form of the rest frame UV morphology seen by
HST. The galaxies are extended on scales of about 10 kpc. They
interpret this as a strong support for the hypothesis that radio
emission traces spatially extended massive star formation within these
galaxies. This is clearly different from what is seen in local ULIRGs
where the far-infrared/radio emission is concentrated in the compact
nuclear region with an extend less than 1 kpc. In the remaining 30%
of the SMG sample, the radio emission is more compact (essentially
unresolved). This is a signature of either a compact nuclear starburst
and/or an AGN.
In conclusion, the exact fraction of distant submillimeter and millimeter galaxies containing an energetically dominant AGN is difficult to extract from observations. However, even in the systems containing an unambiguously powerfully AGN, the far-infrared emission seems to be powered by the star formation. Surprisingly, this seems to be also the case in distant QSOs. Recently, Beelen (2004) has shown that the far-infrared and blue luminosities from the host galaxies of distant radio-quiet QSOs, are slightly correlated. The far-infrared and radio emission of these quasars follow the radio-infrared correlation observed in local ULIRGs (Yun et al. 2001), providing a first indication that the dust is predominantly heated by the star-formation activity rather than by the AGN. Moreover, the non-linearity between the far-infrared and blue luminosities is also an indication that the heating mechanism of the dust is not directly linked to the AGN. However, the presence of this correlation could suggest a causal connection between the formation of stars in the host galaxy and the activity of the central super massive black hole. This connection has been successfully modeled by Granato et al. (2004).
Finally
Houck et al. (2005)
and
Yan et al. (2005)
demonstrate the
potential of using mid-infrared spectroscopy, especially the aromatic
and silicate features produced by dust grains to directly probe
distant L ~ 1013
L ULIRGs at
z ~ 2. Spitzer/IRS observations provide a unique and
direct access to high-z ULIRG physical properties. It will
definitively open the route toward a complete census of the distant
infrared-luminous Universe. A first study on two distant SMGs using
Spitzer/IRS by
Lutz et al. (2005)
finds for one SMG an equal contribution from star formation and AGN. The
second galaxy is dominated by star formation.
 b. From